NYC311 Housing and Building Complaint Analysis
Problem Statement
About NYC311
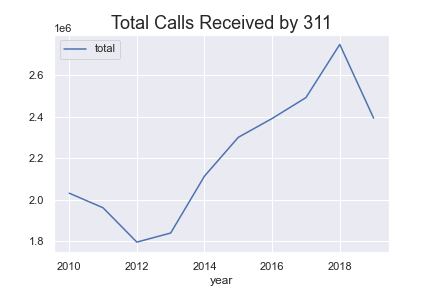
NYC311 by the New York City government provides the public with government and non-emergency services. Complaints will be forwarded to various agencies such as local governments, public utilities, and other public services. Citizens can file a complaint about various problem, such as illegal parking, noise, heating, and apartment maintenance. The complaints are coming from five boroughs, which are Queens, Brooklyn, Bronx, Staten Island, and Manhattan.
Housing and Buildings Complaints
Department of Housing Preservation and Development (HPD) is the agency responsible to process the complaints related to housing and building. HPD fields most reports, second only to the NYC Police Department.
HPD is seeking help to manage the large volume of complaints by focusing on the most pressing complaint and determine the possibility of the complaints. This analysis provides insight to the trends of the complaint received by HPD.
We also investigate the relationship between building characteristics with the complaint type of our focus.
Datasets
NYC 311 Service Requests
- Complaint details such as complaint type, location and address, complaint response, status.
- Raw dataset: >10M rows, 16 columns
PLUTO Dataset
- The Primary Land Use Tax Lot Output by NYC Department of City Planning. Contains land use and geographic data at tax lot level.
- Raw dataset: 89k rows, 87 columns
Exploratory Data Analysis
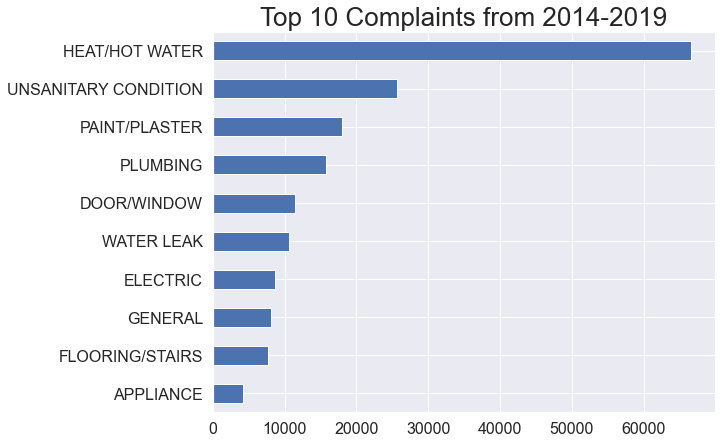
Top 10 Complaints in 2015 - 2019
There are 14 types of complaints under Housing and Buildings category, with HEAT/HOT WATER having the highest number of complaints. This type of complaint comprises 37.9% of the total complaints on housing and buildings.
Building owners are required to meet the heat requirements according to the law. This includes residential building, commercial building, and other public facilities such as child care, nursing home, homeless shelter, and public school. When the heat requirements are not met, citizens can file a complaint. The NYC311 Service does not serve complaints coming from private homes, apartments, and other residential spaces.
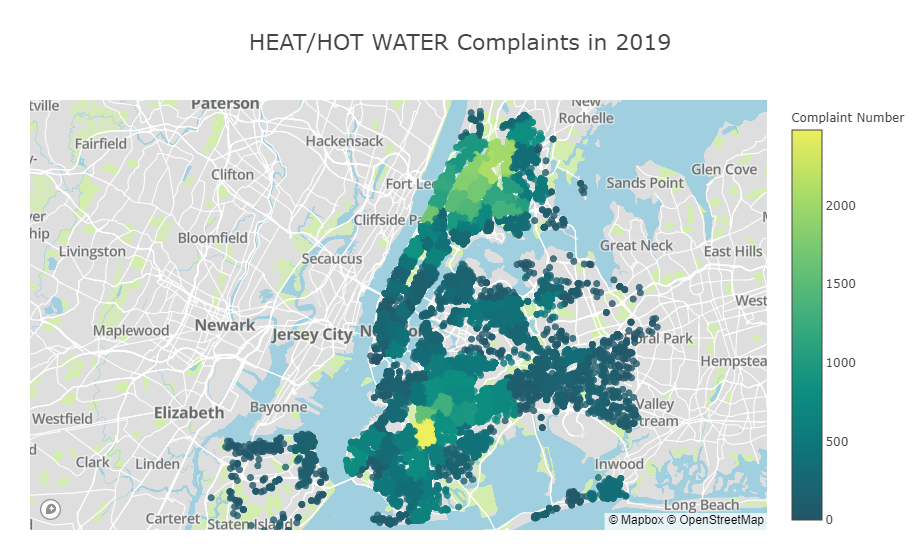
Bronx has the highest number of HEAT/HOT WATER complaints from 2015 - 2019, followed closely with Brooklyn. On the other hand, Bronx only has population of 2.7 million, the fourth highest after Brooklyn, Queens, and Manhattan. This means the heat complaint in Bronx has the highest density compared in the other borough.
More than 1/3 of housing and buildings complaints are HEAT/HOT WATER complaints.
Heat Complaints at Borough Level
Bronx has the highest number of HEAT/HOT WATER complaints despite being only the 4th most-populated borough. This suggests that Bronx has the highest heat complaints density.


Our analysis will focus on HEAT/HOT WATER complaints in Bronx.
Heat Complaints Map at Zip Code Level
Heat Complaints Pattern
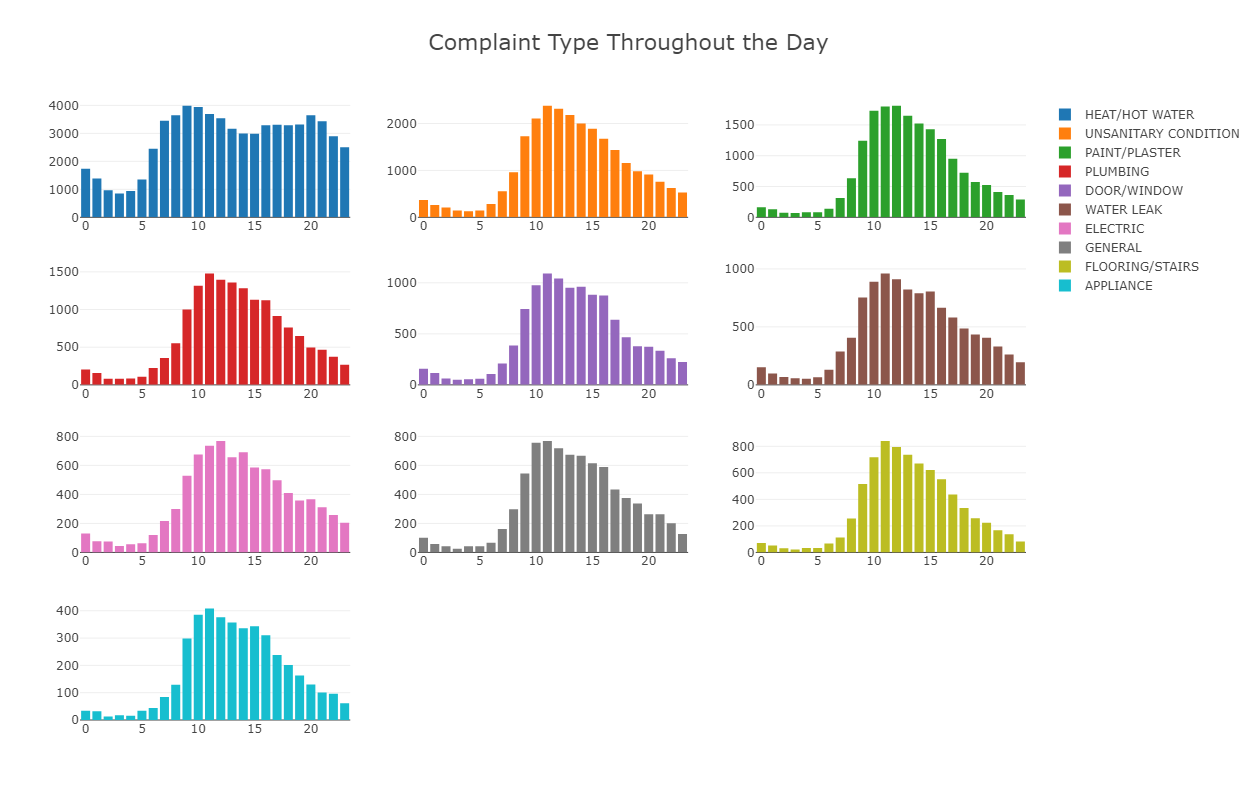
We can observe patterns in heat complaints throughout the year, week, and day. The city regulation demands building owners to provide tenants with minimum heat requirements between Oct 1st and May 31. The heat requirements vary based on the hour and outside temperature. During work hours (6 AM - 10 PM) the heat requirement (minimum 68 degrees) is applied only if the outside temperature falls below 55 degrees. Outside that time window (during nighttime) heat should always meet the required temperature (minimum 62 degrees) without no specification about outside temperature.
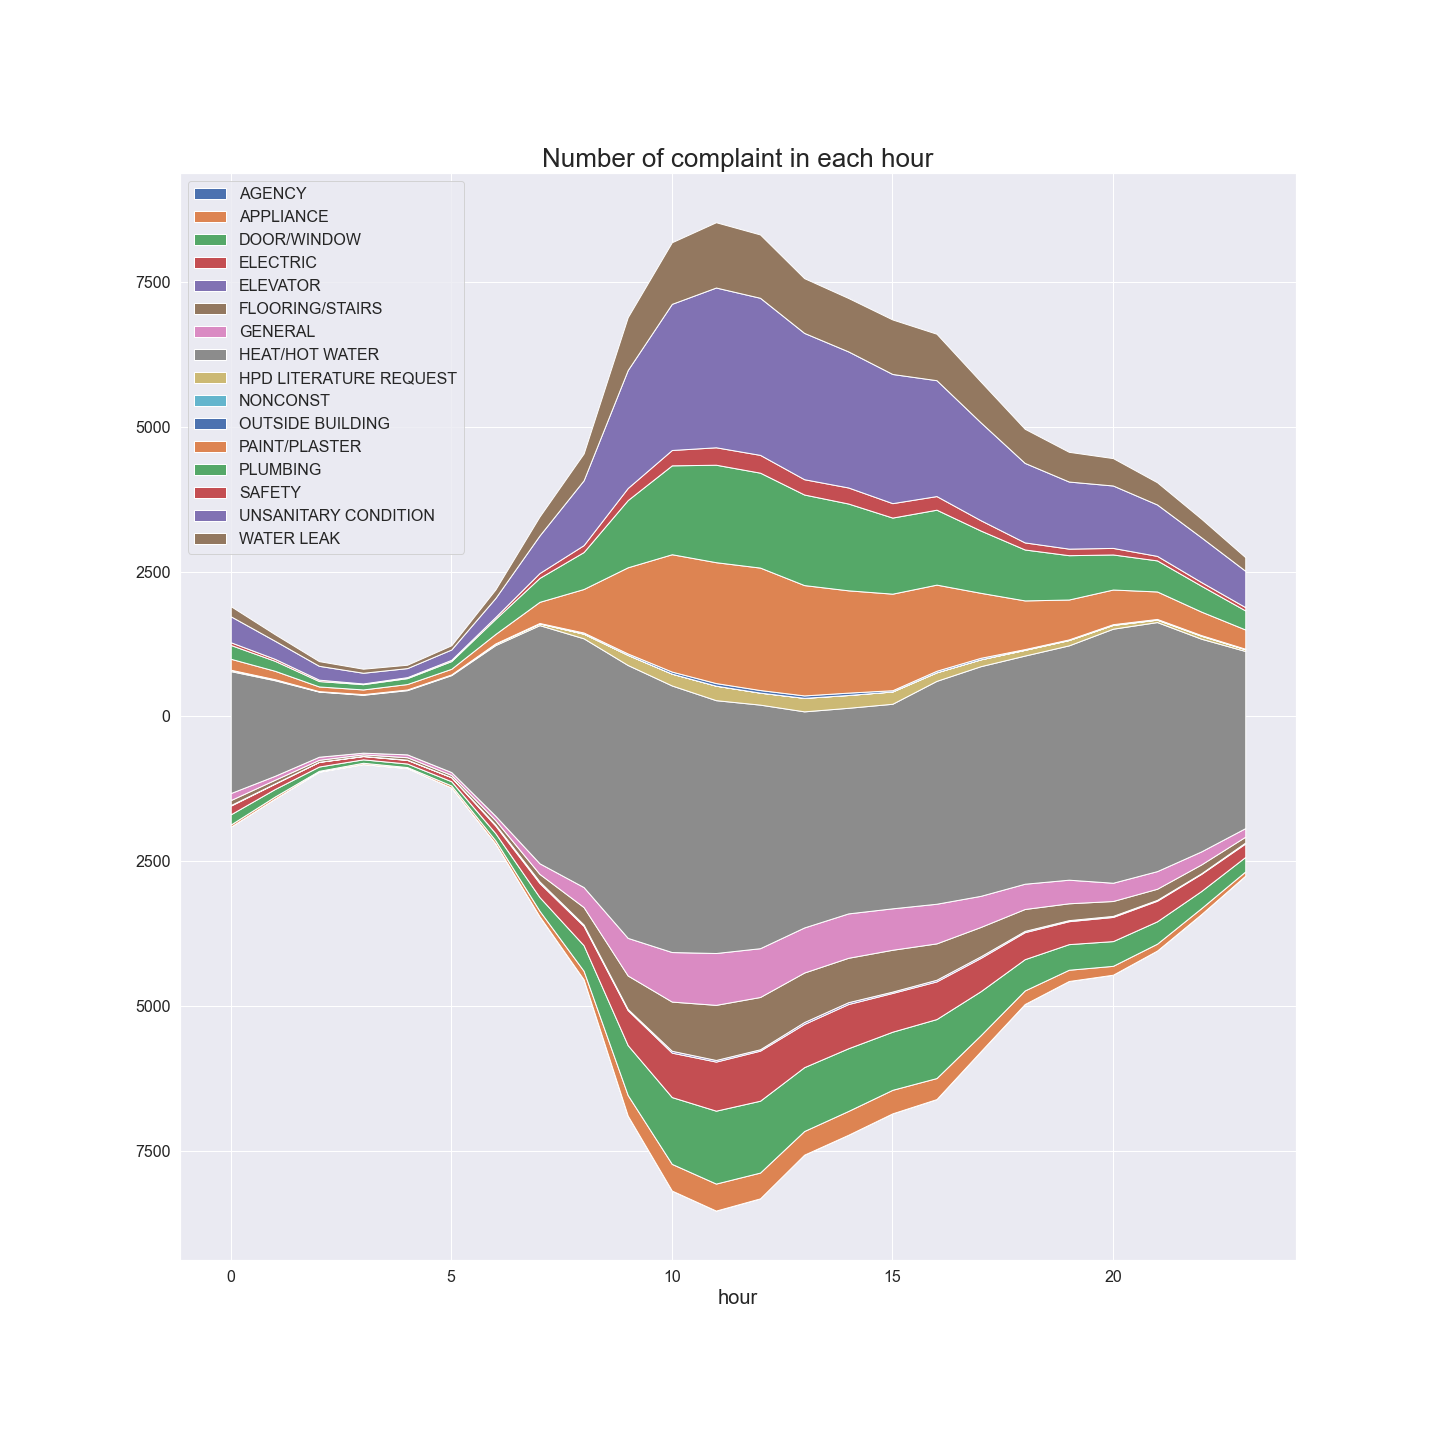
The higher minimum temperature requirement during work hours (starts at 6 AM) explains the daily HEAT/HOT WATER complaint pattern which was very low during nighttime (0 - 5 AM) and started to rise at 6 AM time. This also explains the reason the number of HEAT/HOT WATER complaints stayed high even after normal work hour ends (~4 PM), while the other complaint types kept decresing until it reached nighttime.

The regulation specifies heat requirement during the day, which applies throughout the week during Oct 1 - May 31. Since there is no specific regulation on heat requirement during the week, there is no difference in number of HEAT/HOT WATER complaints throughout the week, even during weekend. This suggests that most HEAT/HOT WATER complaints come from residential building, unlike the other complaints that have lower number during the weekend.
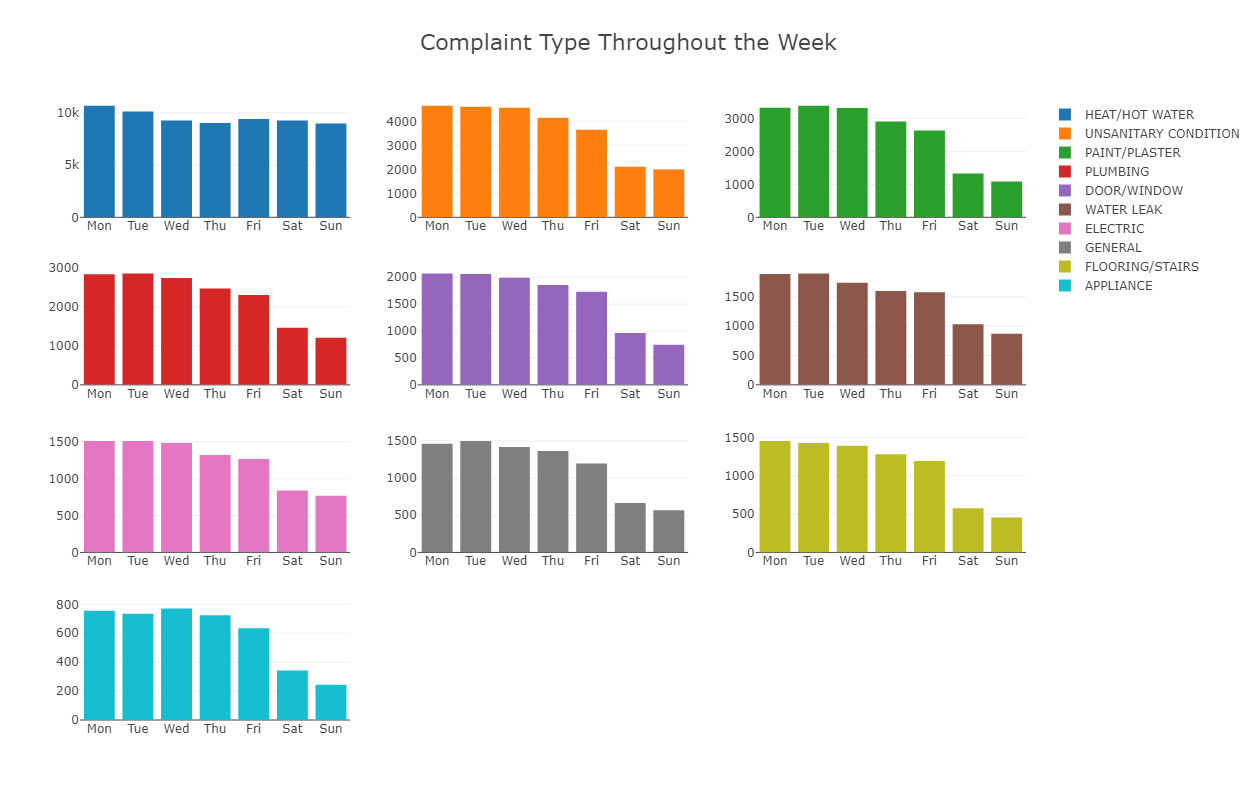
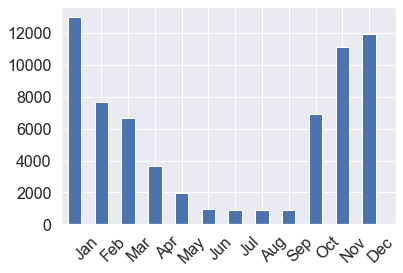
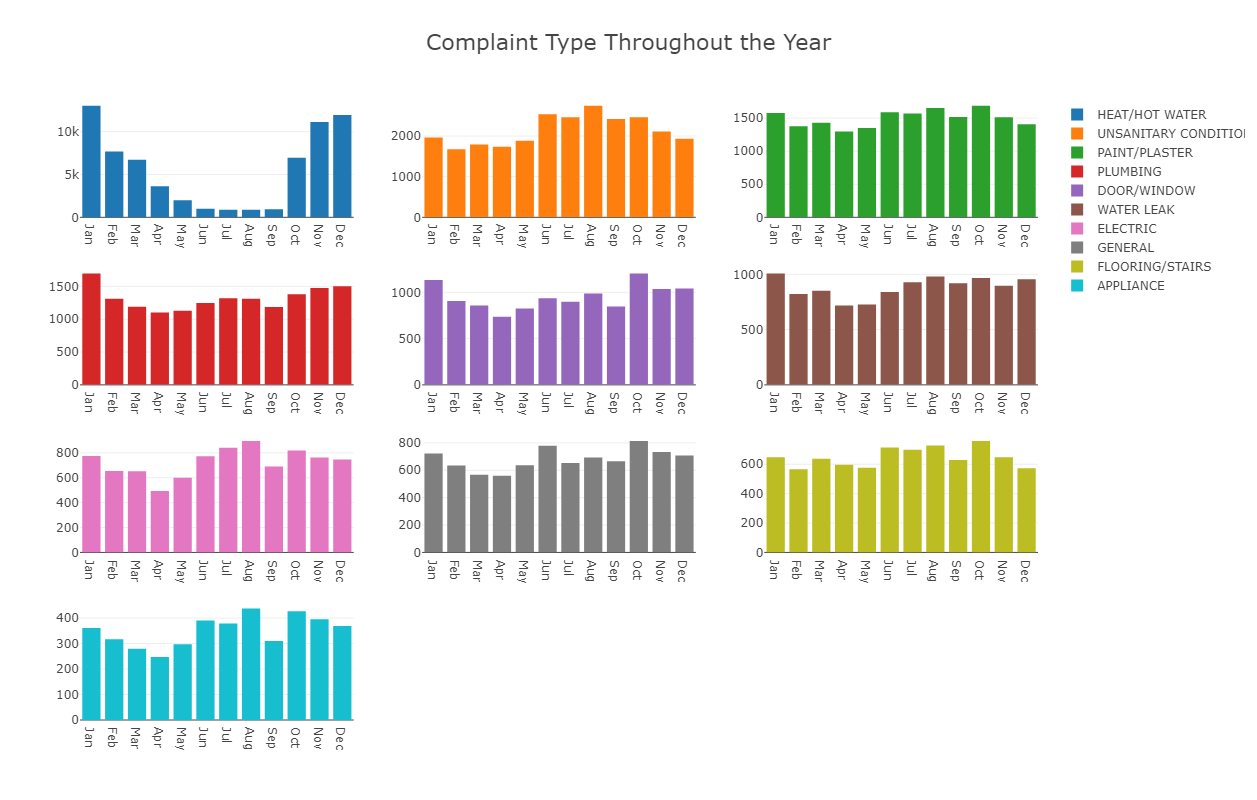
While the other type of complaints have a relatively steady number of complaints throughout the year, HEAT/HOT WATER complaint has lowest number from late spring (June) until early fall (Sep). The HEAT/HOT WATER complaints about excessive heat are accepted only during this period.
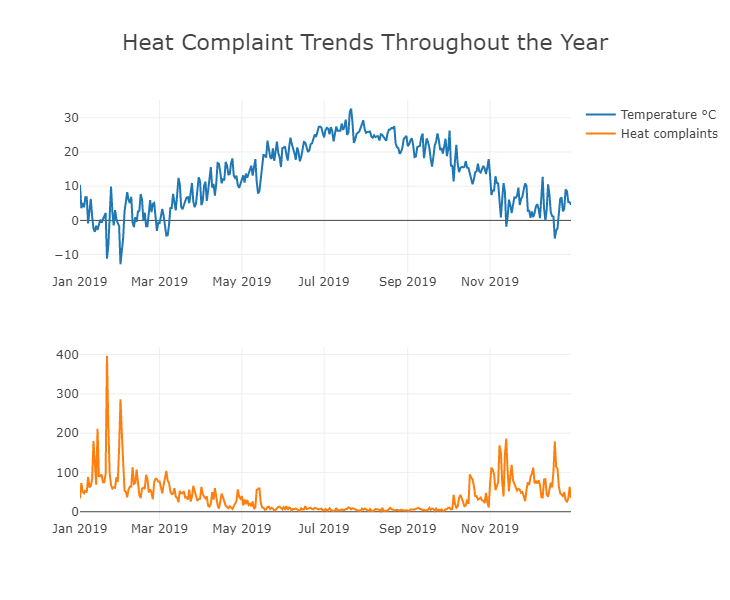
Trends Throughout the Year
We can look into heat complaint trends throughout the year by comparing the number of complaints and the average temperature in NYC in 2019. As expected, HEAT/HOT WATER complaints started happening in fall and peaked in January when the temperature hit the lowest. The highest peak of heat complaints happened in the same day during the lowest peak of temperature, which were Jan 21st and 31st. (dataset from NOAA)
Complaint Volume Throughout the Day
At any given hour, HEAT/HOT WATER has the highest number of complaints among the other under houses and buildings complaints.
Predictive Modeling
Goal
- Predict whether a building will have a heat complaint at a certain time during a day on a certain month, given its characteristics.
- When the prediction is done for buildings at a certain area (for example zip code), we can tell the total heat complaint in that area and decide which area needs more attention
Metrics
We care only about the positive class (heat complaints), thus we will use F1 score as the main metrics to evaluate our model.
Features Used
Dataset used was the NYC 311 Service Request and PLUTO Dataset merged on the incident address. There are 12 final features used:
| No | Feature | Description |
|---|---|---|
| 1 | month | the month the complaint happens |
| 2 | OfficeArea | an estimate of the exterior dimensions of the portion of the structure(s) allocated for office use |
| 3 | GarageArea | an estimate of the exterior dimensions of the portion of the structure(s) allocated for garage use |
| 4 | StrgeArea | an estimate of the exterior dimensions of the portion of the structure(s) allocated for storage use |
| 5 | ResArea | an estimate of the exterior dimensions of the portion of the structure(s) allocated for residential use |
| 6 | BldgArea | the total gross area in square feet |
| 7 | OtherArea | allocated area other than for Residential, Office, Retail, Garage, Storage, Loft or Factory use |
| 8 | NumFloors | in the tallest building on the tax lot, the number of full and partial stories starting from the ground floor |
| 9 | UnitsTotal | the sum of residential and non-residential (offices, retail stores, etc.) units in all buildings on the tax lot |
| 10 | AssessTot | the tentative assessed total value for Fiscal Year 2018 |
| 11 | hourbin | the hour time the complaint happens, mapped into early morning, morning, afternoon, and evening |
| 12 | bldgperlot | building area per lot area |
Baseline Model
-
Majority classifier
Always predict the majority class, in this case 0 or “No” (not heat complaint), for the target value
- F1 score: 0
- Accuracy: 0.62
-
Single feature
The class is predicted by only one variable. We will make a decision tree with only one decision level with the most-informative feature (decision stump).
- F1 score: 0.42
- Accuracy: 0.64
Benchmark Model
Cross -validate using combination of several models and strategies on train and evaluation set. The models used are:
- Logistic Regression
- Decision Tree Classifier
- Stochastic Gradient Descent
- Naive Bayes
the strategy used for these pipelines are:
- Oversampling with SMOTE
- Scaling with MinMaxScaler
- Feature selection with RFE
- Oversampling with RandomOverSampler
- Combined oversampling (SMOTE) and undersampling (TomekLinks) with SMOTETomek
- Combined oversampling (SMOTE) and undersampling (ENN - Edited Nearest Neighbours)with SMOTEENN
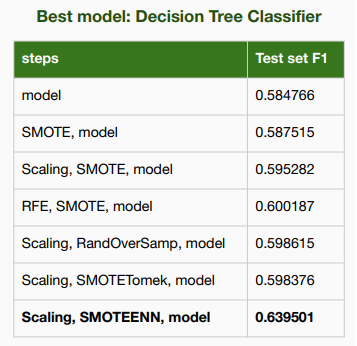
Model Improvement
Improve the benchmark model (DecisionTreeClassifier with scaling and SMOTE-ENN) with these strategies:
- Boosting with AdaBoostClassifier
- Bagging with RandomTreeClassifier
- Hyperparameter Tuning
Fit model with train and validation dataset, then evaluate on test dataset.
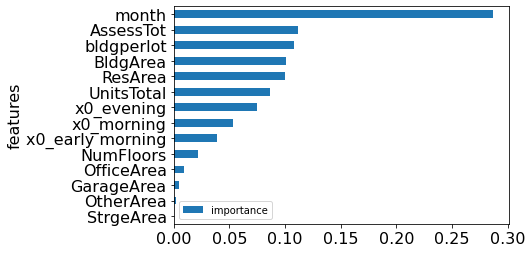
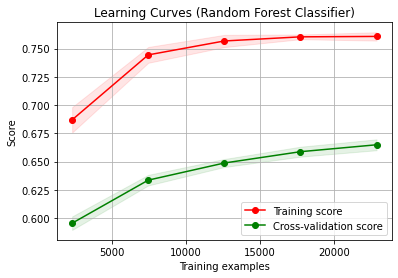
Best Model
Random Tree Classifier with 50 estimators and maximum depth of 20 has the best result with F1 score and accuracy of 0.67. The most important feature is month.
Both the validation score and the training score are increasing over increasing training examples, which suggests that it might be beneficial to add more training example. on the other hand, judging by the small F1 score increase over wide range (0 to ~25000 rows) of data, the score might increase but only very slightly.
Making Use of the Model
- Predict heat complaint at building/tax lot level
- Count the total heat complaints in a certain area (e.g. zip code)
- Choose the area with the highest number of complaints to focus on
We will use our model prediction to ultimately count the total heat complaints in a certain area and then choose only the area with the highest number of complaints to focus on. Thus, we want to be as confident as possible when predicting whether a building will have a heat complaint or not -> increase the threshold, for example, to 0.7 to increase the precision.
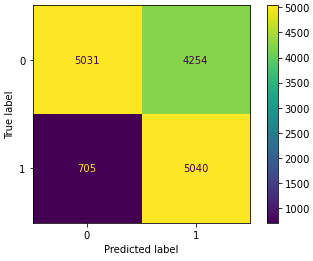
Threshold = 0.5
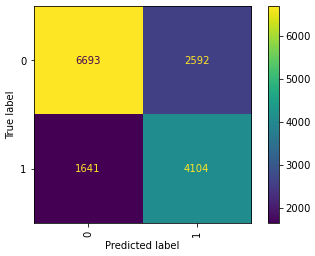
Threshold = 0.7
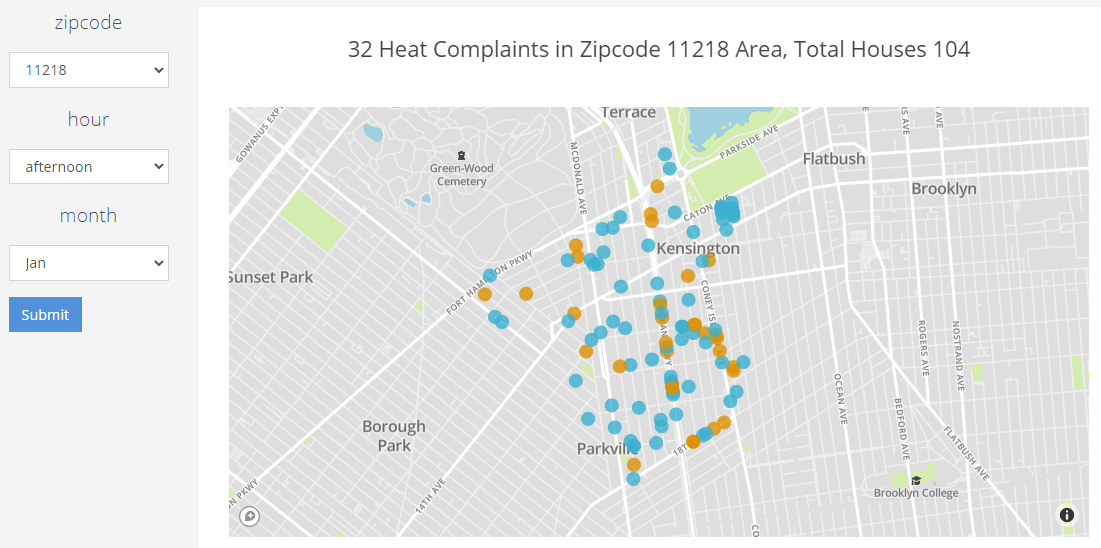
Prediction Example
Interpretation: According to our model, in the afternoon of a day in January in the area with zip code 11218 there are 32 heat complaints from total of 104 buildings
Conclusion
- We have analyzed housing and buildings complaints and chose heating problems as the complaint we should focus on, more specifically in Bronx.
- We have analyzed the pattern related to heat complaints in comparison with non-heat complaints.
- We have built a model that predicts the type of complaint sent to the NYC 311 Service Call based on several available tax lot information.
- The model suffers from overfitting, but with threshold adjustment we can get a more confident prediction.